

By highlighting the social, political and technological progress already made, this open access book presents an optimistic outlook for a transition to a climate-neutral world and successful adaptation to climate change.
With a focus on economics and policy, it covers a wide range of cases where climate action is heading in the right direction. Short digestible chapters highlight, among other things, growing awareness among the general population and the willingness to act, and present technologies and policy measures that have already led to emission reductions.
Here you can access and download all the figures and tables from the book.

Fig 1
Global mean temperature trends from 1850 to 2024. Temperatures have increased over time and the increase has been faster than in previous years in 2023 and 2024.
Fig 2
Fig 6
Fig 4
Fig 14
Fig 16
Fig 22
Fig 25
A comparison of the impact of global temperature increases of 1.5°C, 2°C, and 3°C on various environmental and social factors, such as biodiversity loss, food security, extreme heat and sea level rise. It shows that climate impacts become substantially more severe the higher the temperature increase.
Fig 3
Greenhouse gas emissions from 2000 to 2100 under different scenarios. With currently implemented policies, emissions are projected to remain roughly constant at their current level. Limiting global warming to 2°C requires cutting emissions by about 60% by 2050. Achieving the 1.5°C makes even sharper emission reductions necessary.
Climate change attitudes across 16 countries, categorized into segments: Alarmed, Concerned, Cautious, Disengaged, Doubtful, Dismissive, and No segment. Mexico shows the highest awareness of climate change risks with 64% of respondents being alarmed and 24% concerned. In Indonesia, which shows the least concern about climate change, 27% of respondents are alarmed and 26% concerned.
Climate protests have taken place in almost all European countries, the US, Canada, Mexico, Australia New Zealand, Indonesia, Japan, India, Pakistan as well as several countries in South America and Africa.


Fig 5
Number of articles per source from 2005 to 2025, categorized by region: Africa, Asia, Europe, Middle East, North America, Oceania, Central/South America, and Wire Services. A significant peak occurs around 2010. From 2013 on there is an upward trend with substantial fluctuations.
Fig 7
Climate change cases around the world have increased from 884 in 2017 to 2180 in 2022. The number of jurisdictions represented has risen from 24 in 2017 to 65 in 2022. Most cases were filed in the US, their number has increased from 654 to 1522 in the period 2017 to 2022.
Fig 8
The number of institutions committed to fossil fuel divestment has risen from less than 100 in 2012 to about 1500 in 2021. The assets managed by institutions committed to fossil fuel divestment has increased from close to zero in 2012 to almost USD 40 trillion in 2022.
Fig 9
The share of respondents who agree that the transition to a climate-neutral economy must also address inequalities ranges from 39% in South Korea to 68% in the EU. The share of respondents who agree that lower-income countries affected by climate change should be compensated ranges from 58% in the UK to 76% in South Korea.
Fig 10
Fig 11
Fig 12
Fig 13
Fig 15
Fig 17
Fig 18
Fig 19
Fig 20
Fig 21
Fig 26
In recent years the global population has grown less quickly. The median scenario projects a peak global population at slightly above 10 billion people in the 2080s. Low fertility scenarios project global population to peak in the 2050s at slightly below 9 billion people.
The share of G20 countries that have climate policies for electricity and heat, industry, land transport, building and agriculture and foresty has increased substantially between 2000 and 2020. Overall, fiscal and financial incentives are the most widely deployed policies. Codes and standards are also prominent in all sectors. For electricity and heat and land transport, public investment also plays a prominent role.
Many jurisdictions have targets to phase out internal combustion engines by 2035 or earlier. In the European Economic Area as well as Chile, only battery electric vehicles or vehicles powered by fuel cells will be permitted. Canada and some US states will still allow plug-in hybrid vehicles.
Regions with carbon taxes or emission trading systems include parts of Europe, China, Canada, Mexico, Colombia, Chile, Argentina, South Africa, Japan and Kazakhstan. Carbon pricing is also implemented in many sub-national jurisdictions.
The number of green industrial policies deployed in high-income countries has increased from a very low level in 2010 to almost 4500 in 2022. For middle-income countries it has increased from close to zero to almost 200.
Environmental provisions in preferential trade agreements have been used since the early 1990s and increased steadily since then. In the year 2020, preferential trade agreements contained on average almost 60 environmental provisions each, some included almost 120.
Cities and regions all over the world have adopted climate policies. In the Middle East, Eurasia, South-East Asia and Africa, climate policies are predominantly on the city level, in North America on the regional level. In all other world regions, cities and regions have a comparable number of climate policies in place.
The levelized cost of electricity (LCOE) for solar photovoltaic, concentrated solar power, offshore wind, and onshore wind have decreased massively between 2010 and 2023 so that these technologies are now competitive with fossil energy sources. Costs for geothermal and hydropower have increased slightly but are still at the lower end of costs for fossil power.
The costs per kilowatt-hour for battery storage and EV batteries have declined by about 90% between 2010 and 2023.
Globally registration of electric vehicles has increased from less than 3 million in 2018 to alost 15 million in 2023- About two thirds of these are battery electric vehicles and the remainder plug-in hybrids. China is the largest market for electric cars with almost 9 million registered in 2023. Europe and the US account for most of the remainder.
Finland, Norway and Sweden have the highest annual sales of heat pumps even though they have the lowest averages temperatures.


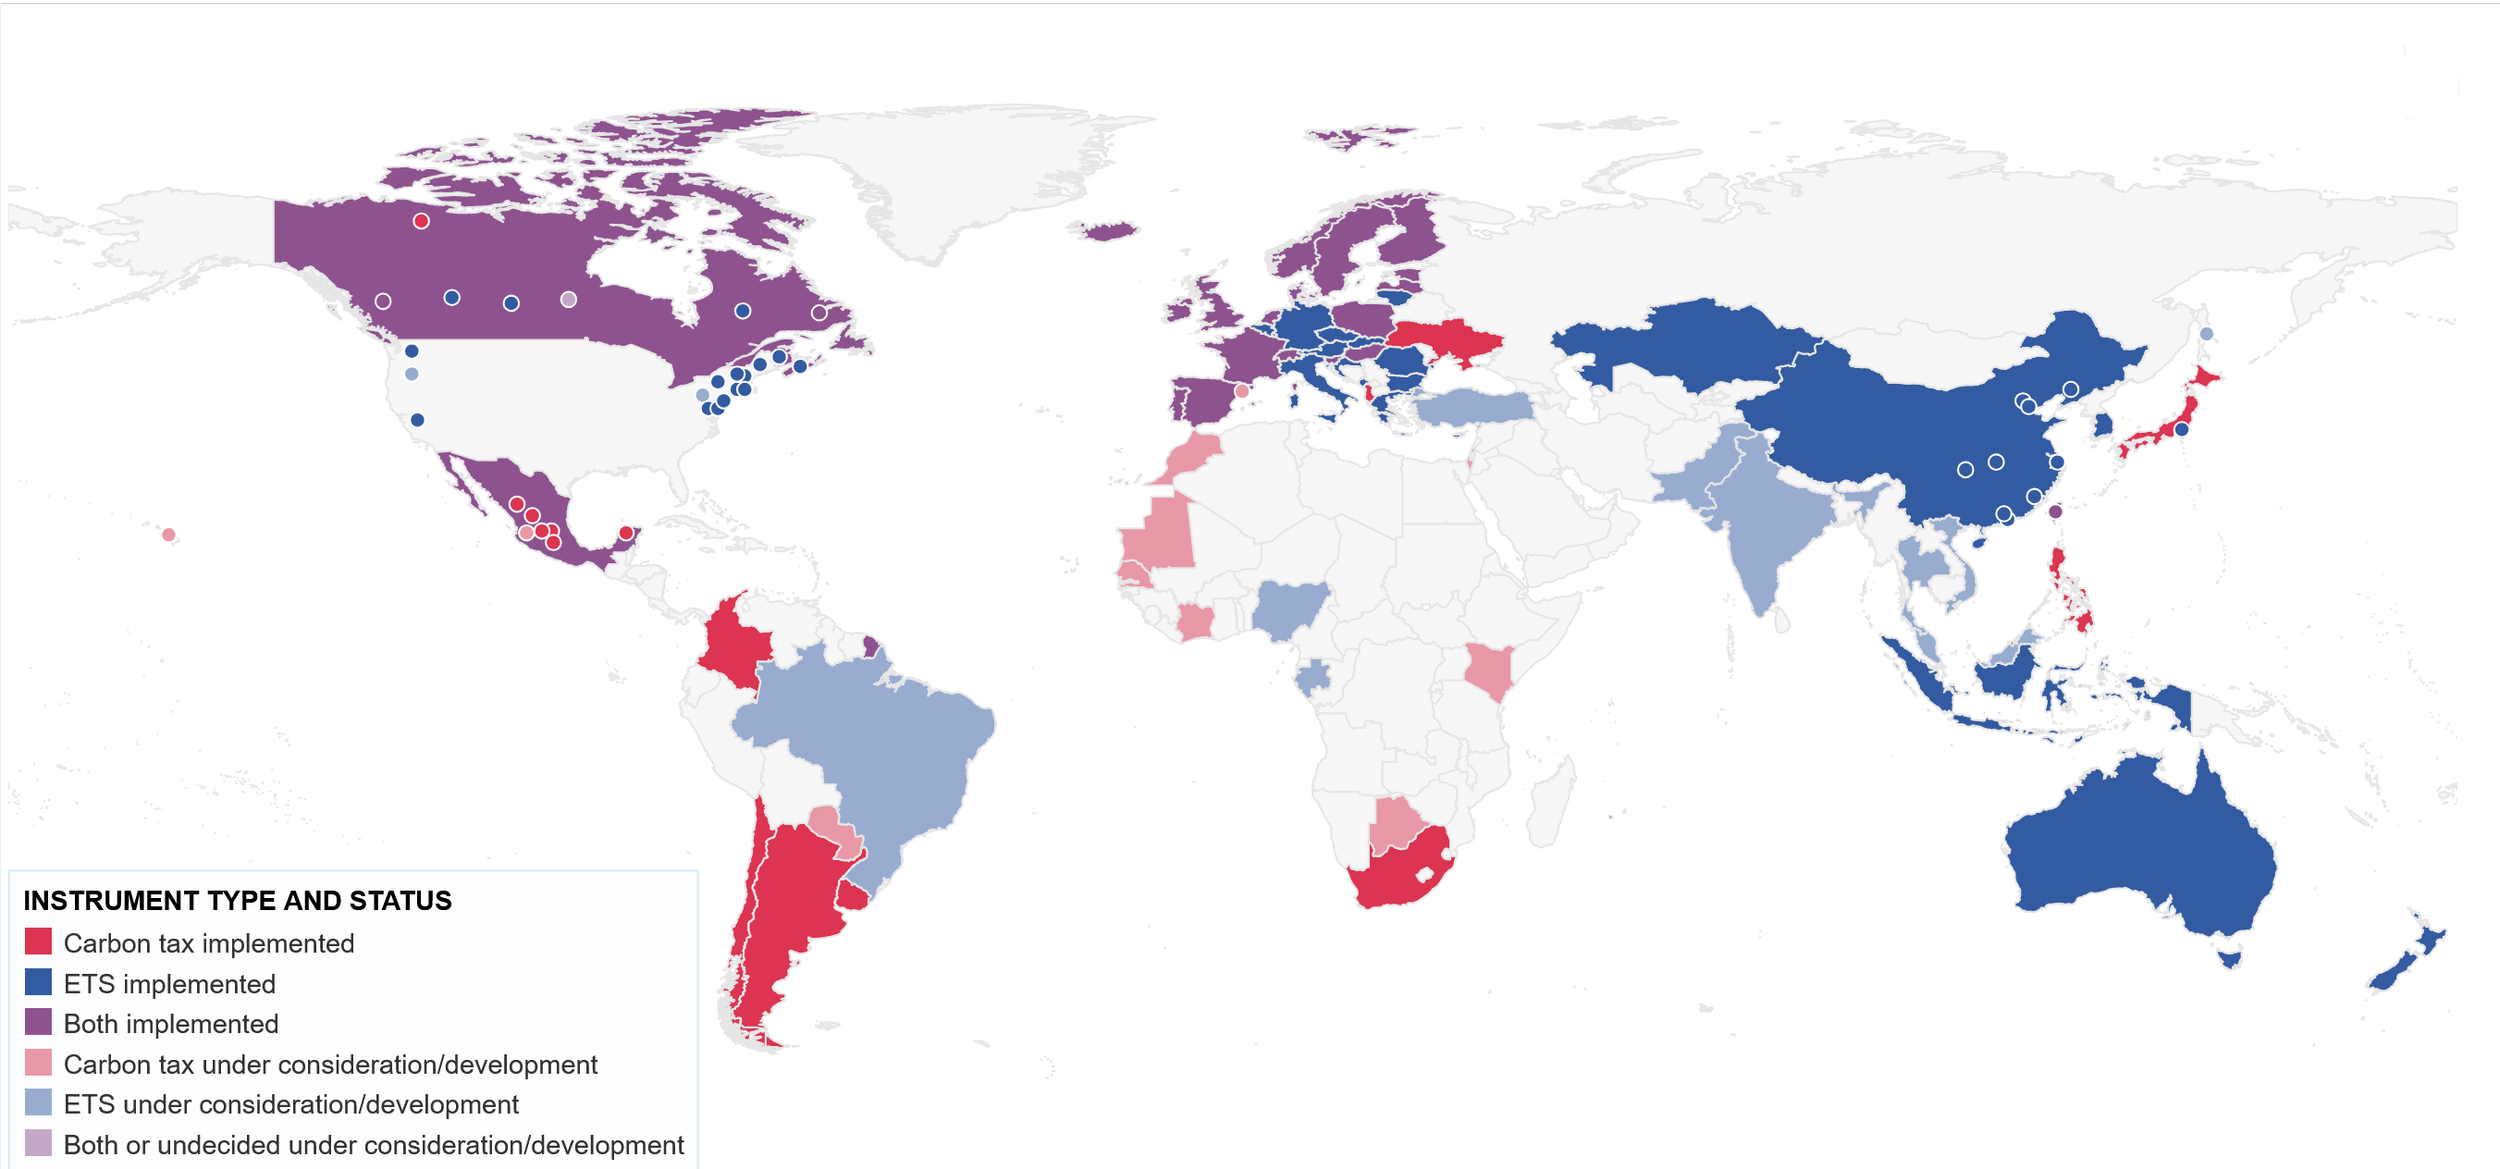


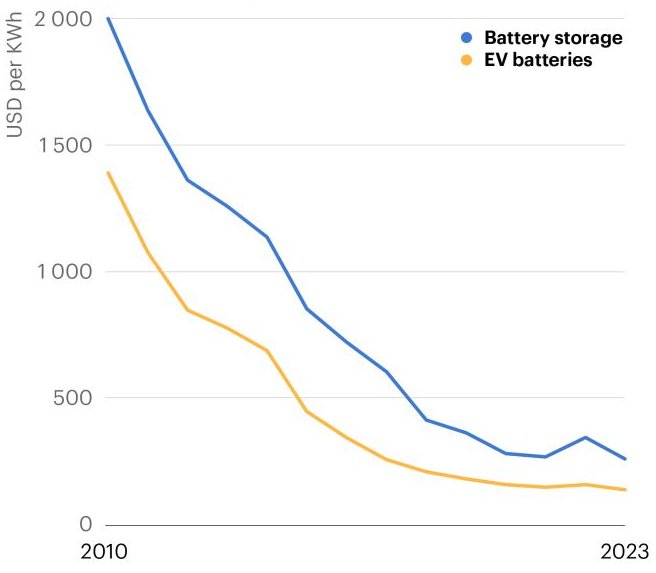


Fig 23
Fig 24
Some industrial sectors could already be fully electrified by 2025. By 2035, almost all industrial activities could be electrified. The exception is iron and steel, for which 202 Terrawatthours of annual fuel demand are projected beyond 2035.
Circular economy approaches could reduce emissions from steel, plastics, aluminum and cement in the EU by 56% by 2050. Plastics show the highest reduction potential. In terms of strategies, materials circulation can achieve about 60% of the emission reductions and product materials efficiency and circular business models about 20% each.
In late 2019, about 18 Gigawatts of electrolyzer capacity to produce green hydrogen projects were planned to come online by 2030. By early 2023 this number has risen more than tenfold to 232 Gigawatts.
Machine learning can help to decarbonize electrity production and distribution by forecasting consumers demand and the supply of wind and solar power. It can also improve the management of existing power plants and reduce inefficiencies in the power grid.
Conventional approaches for carbon dioxide removal have a high technological readiness with a storage timescale of decades to centuries. Novel carbon dioxide removal approaches have longer timescales (some of them have more then ten millenia) but lower technological readiness.


The number of high-value patented inventions for adaptation has increased by 6.7% per year, from about 400 in 1995 to about 1500 in 2015. The largest increase took place for coastal and river protection patents. The US, Japan and Germany are the largest source of patents, accounting for 24%, 16% and 11% of the total, respectively

Fig 27
The social, political and technological of climate policies exert feedback on each other.

Tabel 1
Clean energy accounts for more than 16 million jobs globally. Solar PV dominates with more than 7 million worldwide,

Table 2

Table 3
Clean energy accounts for more than 16 million jobs globally. Solar PV dominates with more than 7 million worldwide, followed by liquid biofuels and hydropower, which account for 2.8 million and 2.3 million, respectively. In terms of world regions, China accounts for almost 7.4 million clean enregy jobs, the EU27 for 1.8 million and Brazil for close to 1.6 million. The US and India each have a bit more than 1 million.

Table 4
Clean energy accounts for more than 16 million jobs globally. Solar PV dominates with more than 7 million worldwide, followed by liquid biofuels and hydropower, which account for 2.8 million and 2.3 million, respectively. In terms of world regions, China accounts for almost 7.4 million clean enregy jobs, the EU27 for 1.8 million and Brazil for close to 1.6 million. The US and India each have a bit more than 1 million.

Table 5
Most G20 members have a net-zero target for 2050.For Australia, Canada, the EU, France, Germany, Japan the Russian Federatation, the UK and South Korea, these targets are enshrined in laws. Across countries, there is substantial variation in terms of coverage of greenhouse gases, information on how carbon removal is accounted for as well as the publication of plans, the review process and annual reporting.

Table 6
Clean energy accounts for more than 16 million jobs globally. Solar PV dominates with more than 7 million worldwide, followed by liquid biofuels and hydropower, which account for 2.8 million and 2.3 million, respectively. In terms of world regions, China accounts for almost 7.4 million clean enregy jobs, the EU27 for 1.8 million and Brazil for close to 1.6 million. The US and India each have a bit more than 1 million.

Table 7
For most world region, there is only low evidence of transformational adaptation policies. Notable exception of medium evidence include policies related to oceans in Eurooe and North America and policies related to cities, terrestrial and water in South and Central America.
